Displaying Color Palettes or Swatches in a Select HTML element
It’s been a hot minute since I’ve done a post, let alone a programming-related one. Recently I needed to implement some color palette options for some generated plotly plots. I realized that palette names would probably not be enough for a user to know which one would best fit their needs. So I decided to add some color palette or swatch previews in the “select” HTML element.
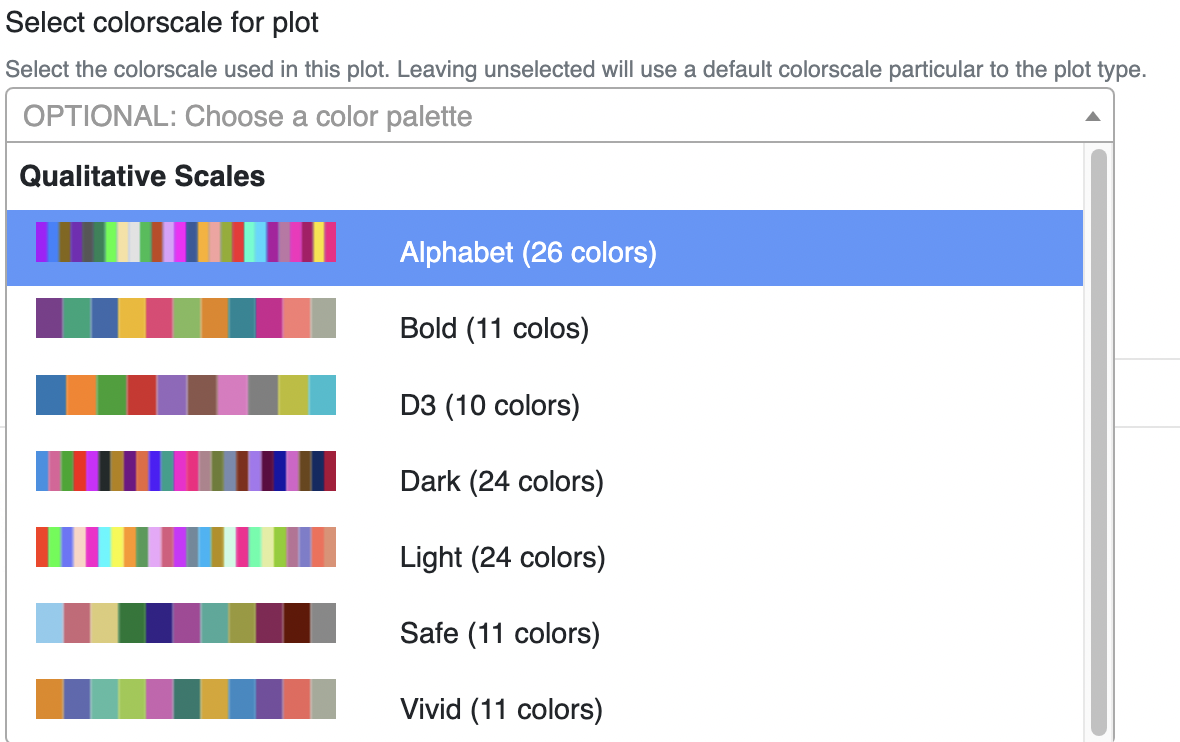
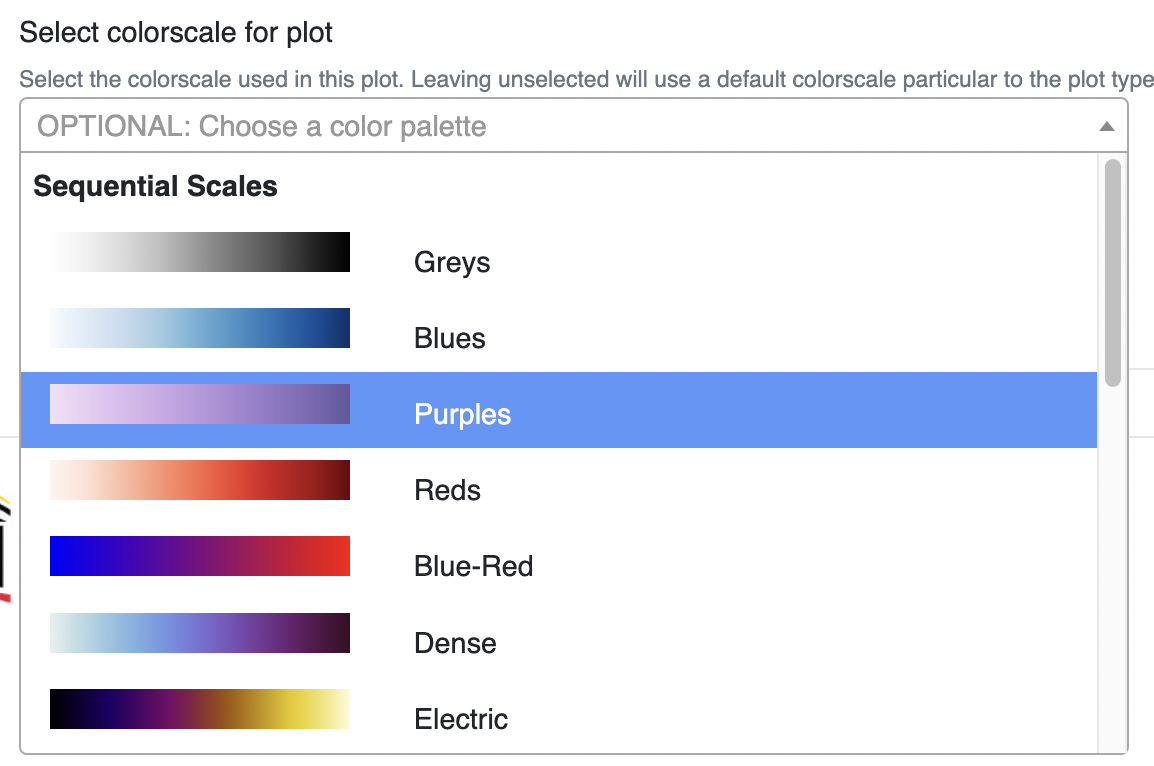
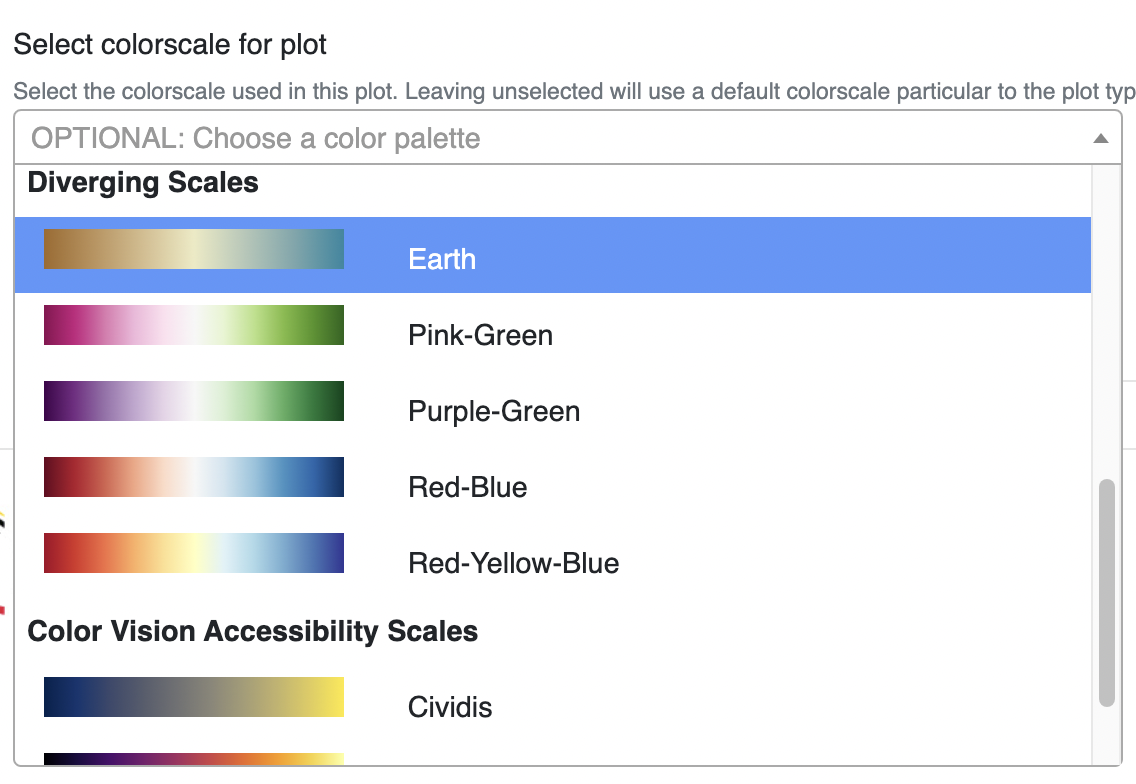
Currently, I have this “select” element display either qualitativee (discrete) color swatches for certain plots, or continuous (numerical) color palettes for other plots. Here are the images of the end result.
Qualitative Swatches

Continuous Swatches


There are a few individual things I needed to do to make this happen.
- Get the Hex or RGB color values for each swatch and palette via an API call to Plotly.
- Use the JSON information to render the “select’ HTML element via JSRender.
- Build a Select2 object in Javascript to serve as the visible “select” element.
- Create a HTML canvas element to display the swatches or the palette gradients when the Select2 object is opened.
First, a starting set of JSON information
Below is a JSON structure of the current swatches and palettes that I let the user choose from in this particular plot generation tool. These are grouped by category under label and stored information on if this set of colorschemes can be used in continuous or qualitative plots.
// color palettes
// Obtained from https://plotly.com/python/builtin-colorscales/
// and https://plotly.com/python/discrete-color/
const availablePalettes = [
    {
        label: "Qualitative Scales",
        continuous: false,
        options: [
            // These need to be kept up-to-date with the "color_swatch_map" in lib/mg_plotting.py
            { value: "alphabet", text: "Alphabet (26 colors)" },
            { value: "bold", text: "Bold (11 colors)" },
            { value: "d3", text: "D3 (10 colors)" },
            { value: "dark24", text: "Dark (24 colors)" },
            { value: "light24", text: "Light (24 colors)" },
            { value: "safe", text: "Safe (11 colors)" },
            { value: "vivid", text: "Vivid (11 colors)" },
        ]
    },
    {
        label: "Sequential Scales",
        continuous: true,
        options: [
            { value: "greys", text: "Greys" },
            { value: "blues", text: "Blues" },
            { value: "purp", text: "Purples" }, // Cannot use in dotplot
            { value: "reds", text: "Reds" },
            { value: "bluered", text: "Blue-Red" },
            { value: "dense", text: "Dense" },
            { value: "electric", text: "Electric" },
            { value: "ylgnbu", text: "Yellow-Green-Blue" },
            { value: "ylorrd", text: "Yellow-Orange-Red" },
        ],
    },
    {
        label: "Diverging Scales",
        continuous: true,
        options: [
            { value: "earth", text: "Earth" },
            { value: "piyg", text: "Pink-Green" },
            { value: "prgn", text: "Purple-Green" },
            { value: "rdbu", text: "Red-Blue" },
            { value: "rdylbu", text: "Red-Yellow-Blue" },
        ],
    },
    {
        label: "Color Vision Accessibility Scales",
        continuous: true,
        options: [
            { value: "cividis", text: "Cividis" },
            { value: "inferno", text: "Inferno" },
            { value: "viridis", text: "Viridis" },
        ]
    },
];
Get the Hex or RGB color values for each swatch and palette via an API call to Plotly
Ok, I’ll first admit that this is a bit inefficient. Currently I have an API call to retrieve this information every time the page loads, but what I should really be doing is obtaining it and just save it into the JSON within the Javascript file since this information does not change. Ideally I did not want to put in an API call to get information from the Plotly package in Python, but Plotly.js had a limited selection of colorschemes to choose from.
FWIW I do plan on omitting this API call in the future and saving the colorscale data into the JSON from earlier. But it is useful to show how I obtained the colorscales.
import plotly.express as px

ALPHABET_COLORS = px.colors.qualitative.Alphabet
BOLD_COLORS = px.colors.qualitative.Bold
D3_COLORS = px.colors.qualitative.D3
DARK24_COLORS = px.colors.qualitative.Dark24
LIGHT24_COLORS = px.colors.qualitative.Light24
SAFE_COLORS = px.colors.qualitative.Safe
VIVID_COLORS = px.colors.qualitative.Vivid

color_swatch_map = {
    "alphabet": ALPHABET_COLORS
    , "bold": BOLD_COLORS
    , "d3": D3_COLORS
    , "dark24": DARK24_COLORS
    , "light24": LIGHT24_COLORS
    , "safe": SAFE_COLORS
    , "vivid": VIVID_COLORS
}

def get_colorscale(colorscale):
    """Return colorscale 2D list for the selected premade colorscale."""
    if colorscale.lower() in px.colors.named_colorscales():
        return px.colors.get_colorscale(colorscale)
    # Must be a qualitative colorscale
    if colorscale not in color_swatch_map:
        raise Exception("Colorscale {} not a valid colorscale to choose from".format(colorscale))

    # Create a 2d list of colors for the selected colorscale at equal distances
    # to keep consistent with continuous colors
    colorscale_list = []
    length = len(color_swatch_map[colorscale]) - 1
    for i, color in enumerate(color_swatch_map[colorscale]):
        colorscale_list.append([i/length, color])
    return colorscale_list
For each color palette or swatch in the JSON above, I run an API call to get_colorscale. If the colorscale is in the list of Plotly color palettes, we can just return the colorscale. This is simply a 2D list where the other list is each step in the color palette, and the inner 2-element list contains a) a step value between 0 and 1 and b) an RGB value.
If the colorscale is not in this list of palettes, it needs to be a valid Plotly qualitative color swatch. I decided not to include all of the Plotly color swatches that are available, so I just perform a check against the color_swatch_map to see if the passed in colorscale argument is in there. If it is not, an Exception is raised. Each of the color swatches actually returns a 1D list of CSS Hex colors, so I add step values to convert to a 2D list in order to keep all returned color information consistent.
This information is returned back to Javascript and stored as another JSON structure, using the colorscale name as keys.
Use the JSON information to render the “select’ HTML element via JSRender
This step happens independently from retrieving the list of colors. Here I have a <select> element and a JSRender template script that will allow us to render our JSON into a “select” options.
    <select class="form-control" id="colorscale_select" aria-describedby="colorscale_help"></select>

    <script id="select_colorscale_tmpl" type="text/x-jsrender">
      <option></option>
      <optgroup label="">

          <option value=""></option>

      </optgroup>
    </script>
In my Javascript file, I have a function that renders the <select> element with the swatch options. Depending on the plot type the user has chosen, the value isContinuous is set to “true” or “false”, and the JSON is filtered to only populate options pertaining to that category.
// Load colorscale select2 object and populate with data
function loadColorscaleSelect (isContinuous=false) {

    let filteredPalettes = availablePalettes;

    // If plot that uses continuous colorscales is chosen, then filter availablePalettes to only those for continuous plots
    // If not continuous, then filter to only those for discrete plots
    filteredPalettes = isContinuous ?
        availablePalettes.filter((type) => type.continuous) :
        availablePalettes.filter((type) => !type.continuous);

    const tmpl = $.templates('#select_colorscale_tmpl');
    const html = tmpl.render(filteredPalettes);
    $('#colorscale_select').html(html);

    /* More to come */
}
You may notice that the final line of code has jQuery syntax. Some may find jQuery to be out-of-date with modern Javascript practices, but in my opinion if it ain’t broke, don’t fix it. There is no need to overengineer a solution by using a more modern framework like Vue or React for simple use-cases like this.
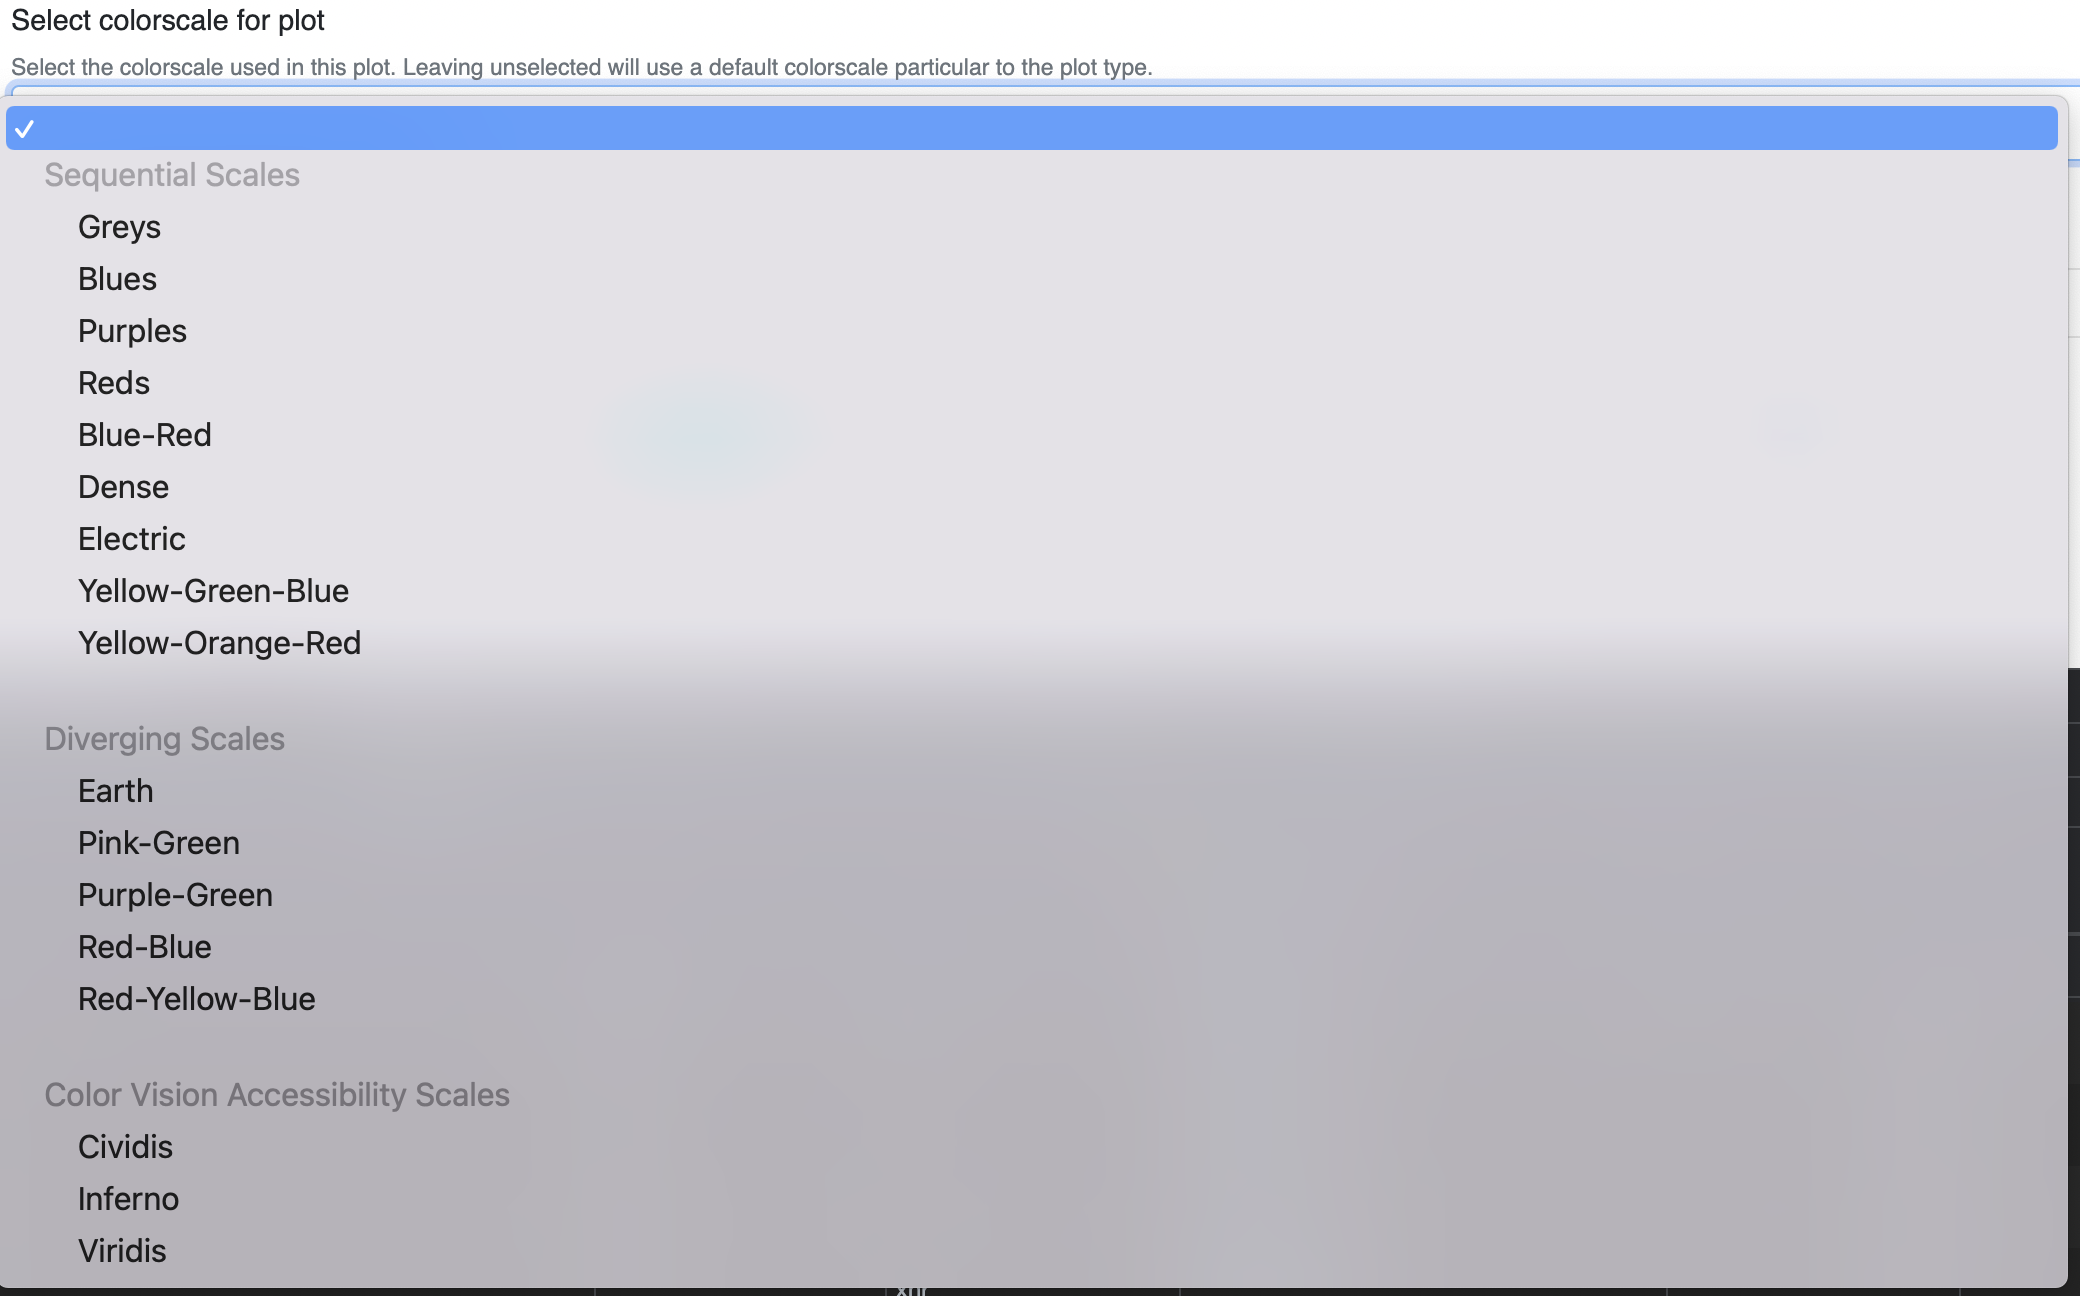
Here is what the <select> element looks like without any flashy additions. (Please excuse the shadow on the box… I took this screenshot when the console was open)

Build a Select2 object in Javascript to serve as the visible “select” element
The next step is to use Select2 to enhance the functionality of the <select> element. Select2 creates a jQuery function for the jQuery selector, and includes things like multiple selection, callbacks, dynamic option creation, and templating of the dropdown or selection.
// Load colorscale select2 object and populate with data
function loadColorscaleSelect (isContinuous=false) {

    /* Filter JSON code and JSRender code (see earlier) */


    $('#colorscale_select').select2({
        placeholder: 'Choose a color palette',
        templateResult: (result) => {return formatColorscaleState(result, isContinuous)},  // Executes every time the dropdown is opened
        width: '50%',
        minimumResultsForSearch: -1
    });
}
The placeholder option displays text when the new “select” box has no selection. The width option customizes the container width, and in this case it is set to the CSS setting width: 50%;. The minimumResultsForSearch option is set to -1 to disable multiple selection in the box.
If the templateResult option were omitted, we can have a valid Select2 box right now. But this box would simply contaain the same text as the original <select> HTML element. In order to add some visually-helpful colorscale information, we need to define the templateResult, whish is executed whenever the Select2 box is opened.
Create a HTML canvas element to display the swatches or the palette gradients when the Select2 object is opened
The templateResult option is defined like this:
templateResult: (result) => {return formatColorscaleState(result, isContinuous)},
For every result, the formatColorscaleState function is executed with information on if this is a continuous or qualitative set of colorscales.
// Create the template for the colorscale select2 option dropdown
function formatColorscaleState (state, isContinuous=false) {
    // Needs to be here to avoid catching the "loading" state JSON object
    if (!state.id) {
        return state.text;
    }
    // TODO: Drop jQuery here and use vanilla JS
    const fragment = $(document.createDocumentFragment());
    const canvas = $(`<canvas id="gradient_${state.element.value}" width="150" height="20" class="pr-3"></canvas>`);
    fragment.append(canvas);
    // Add [0] to "canvas" to return the DOM object instead of the jQuery object
    if (isContinuous) {
        // "paletteInformation[colorscale]" is 2D list of colors by step value
        createCanvasGradient(paletteInformation[state.element.value], canvas[0]);
    } else {
        createCanvasScale(paletteInformation[state.element.value], canvas[0]);
    }
    const text_span = $(`<span class="pl-3">${state.text}</span>`);
    fragment.append(text_span);

    return fragment[0];
}
The formatColorscaleState function first just returns the result text if the internal representation of the Select2 result has no ID. This can be for situations where <optgroup> elements are present, which are still counted in the results. Next, a DocumentFragment is created to build an HTML snippet that will eventually be returned as the result for any <option> element (the colorscales). I chose to do this in jQuery but it is perfectly fine and may be more simple to just do this in vanilla JS. Inside of our DocumentFragment an HTML <canvas> element will be added as well as a <span> element for our result text. The canvas will be generated based on one of two functions depending on if the scale is continuous or qualitative. Note that the canvas has a height and width set, which will be taken into consideration in the below functions.
// Create the gradient for the canvas element using a given colorscale's information and the element HTML object
function createCanvasGradient(data, elem) {
    const ctx = elem.getContext("2d");  // canvas element
    const grid = ctx.createLinearGradient(0, 0, elem.width, 0);    // Fill across but not down
    // Add the colors to the gradient
    for (const color of data) {
        grid.addColorStop(color[0], color[1]);  // [0] => step value, [1] => color
    }
    // Fill the canvas with the gradient
    ctx.fillStyle = grid;
    ctx.fillRect(0, 0, elem.width, 20);
}
For continuous color palettes, we need to use a gradient to properly display the scale. The canvas element’s context and grid are initialized. Remember how our JSON-stored color palette information is a 2D list of colors by step? It’s time to add these into the gradient. After adding all the steps and colors, the gradient is applied to the context, used to fill a rectangle as wide as the canvas element.
function createCanvasScale(data, elem) {
    const elemWidth = elem.width;
    const ctx = elem.getContext("2d");  // canvas element
    // Add the colors to the scale
    const { length } = data;
    const width = elemWidth/length;   // 150 is length of canvas
    for (const color of data) {
        ctx.fillStyle = color[1];
        // The length/length+1 is to account for the fact that the last color has a value of 1.0
        // Otherwise the last color would be cut off
        const x = color[0] * (length/(length+1)) * elemWidth;
        ctx.fillRect(x, 0, width, 20);
    }
}
For qualitative color swatches, instead of using a gradient we want to create equally-sized boxes to represent each individual color in the swatch. The canvas’s context is again intialized. Next we define a number of boxes equal to the number of colors in the swatch and ensure the cumulative size of each box equals the canvas width. For each box, we add the color and set the “x” starting coordinate for the box to fill in this color from this position until the start of the next box. This coordinate is determined by applying a linear scale transformation from the original scale 0 to 1 to the canvas width scale 0 to 150 and adjusting the current step value.
Closing
I hope someone will find this useful, or at least draw some inspiration for some related work that they have. I am sure that there are some steps here and there that I could have simplified or packages that would have essentially did this work for me. But at the least, I wanted to show my thought process on how I approached this issue in my real-world situation.